29
Market Depth and Liquidity Analysis: A Practical Guide for Traders

Imagine you are at a grocery store checkout. You look down the line and see twenty people waiting. That long line tells you something important: there is plenty of stock on the shelves, and the cashier can handle the flow without stopping. Now imagine an empty store with no one in line. It feels quiet, but if you suddenly needed to buy fifty items, you might find the shelves bare or the system overwhelmed. In financial markets, this "line" is called market depth, and it is the single best indicator of whether you can trade big amounts without wrecking your own price.
We often hear about "liquidity," but that word is vague. Market depth gives us the hard data. It shows exactly how many buy and sell orders sit at every price level right now. For traders in traditional stocks, futures, and increasingly in blockchain assets like Bitcoin or Ethereum, understanding this depth is the difference between executing a clean trade and getting slapped with massive slippage. This guide breaks down what market depth actually is, how to measure it, and why your screen might be lying to you.
What Is Market Depth?
Market depth is the ability of a market to sustain a substantially larger order without making an impact on the security's market price. Think of it as the cushion between the current price and the next available buyer or seller. If you want to sell 1,000 shares of Apple, market depth tells you if there are buyers ready to take them at $150, $149.90, or $149.80.
The Federal Reserve formally defined market depth in a February 2025 working paper as "the availability of resting orders to trade." Resting orders are those sitting in the order book, waiting to be filled. When these orders are plentiful, the market is "deep." When they are scarce, the market is "shallow." The Corporate Finance Institute puts a number on this: if a $1 million trade moves a stock’s price by less than 0.1%, that market is deep. If that same trade moves the price by more than 0.5%, the market is shallow. This distinction matters because shallow markets punish large trades with higher costs.
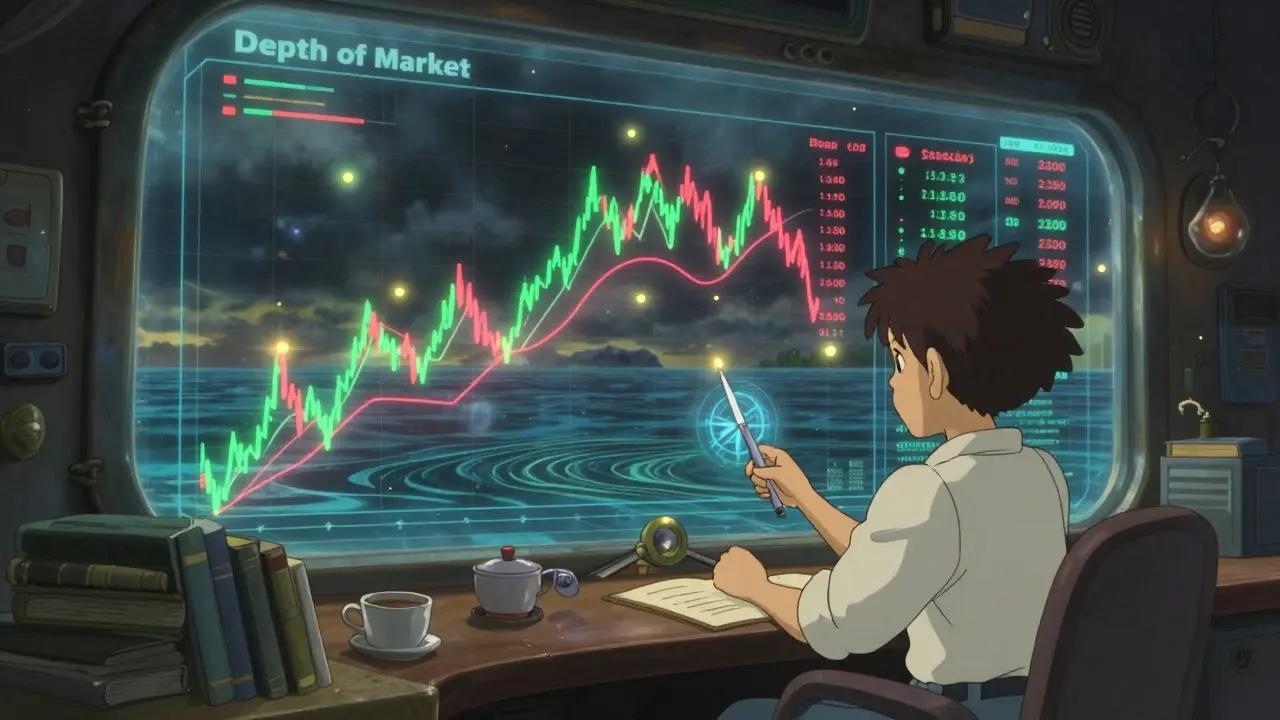
How to Measure Market Depth
You cannot measure depth with just one number. It requires looking at three interconnected facets: order flow, volume, and the Depth of Market (DOM).
- Order Flow: This tracks the number of buy and sell orders entering the market per second. Strong, consistent order flow indicates a healthy, deep market. StoneX noted in 2023 that robust order flow promotes efficient asset pricing because it ensures there is always someone on the other side of the trade.
- Volume: Volume is the total number of contracts or shares traded in a period. While high volume suggests activity, it doesn't always equal depth. You can have high volume from panic selling in a shallow market, which causes wild price swings.
- Depth of Market (DOM): Also known as the Level 2 quote, the DOM is a real-time ladder visualization. It displays cumulative order quantities at each price level. Most standard platforms show the top 10-20 levels. Professional systems, like NASDAQ’s TotalView, provide even deeper visibility.
A critical technical metric used by professionals is the "2% depth." This measures the total liquidity available in the order book at prices 2% above and below the current market price. Keyrock’s 2024 liquidity analysis framework highlights this as a key benchmark for assessing whether a market can absorb sudden shocks without collapsing.
Market Depth Across Asset Classes
Not all markets are created equal. The depth varies wildly depending on what you are trading. Understanding these differences helps you adjust your strategy. For example, you cannot trade Bitcoin with the same size positions you would use for US Treasury bonds.
| Asset Class | Example Instrument | Median 2% Depth | Liquidity Profile |
|---|---|---|---|
| Treasury Bonds | 10-Year US Note | $1.2 Billion | Extremely Deep |
| Large-Cap Stocks | Apple (AAPL) on NASDAQ | $42.3 Million | Deep |
| Cryptocurrency | BTC-USD on Coinbase Pro | $8.7 Million | Shallow |
As the table shows, Treasury markets are incredibly deep. A $10 million trade in 10-year notes barely ripples the surface. In contrast, cryptocurrency markets like BTC-USD are significantly shallower. A trade that is negligible in Treasuries could cause a 1% swing in crypto. This is why institutional investors treat these asset classes differently. They rely on aggregate depth metrics for large block trades in equities, while short-term traders use DOM visualization for precise entries in futures and crypto.

The Danger of Illusion: Spoofing and Iceberg Orders
Here is the catch: what you see on your screen is not always what you get. Market depth analysis has a major vulnerability called "liquidity fragility." Andrew Meldrum and Oleg Sokolinskiy from the Federal Reserve found that Treasury market depth can deteriorate by up to 73% within 15 minutes during stress events. Just when you need liquidity most, it vanishes.
In faster-moving markets like crypto and equities, bad actors exploit this. Dr. Emily Zhao, a finance professor at Stanford, warned in 2024 that overreliance on visible depth is dangerous because high-frequency trading (HFT) algorithms use techniques to mask true liquidity. Two common tricks are:
- Spoofing: A trader places a massive buy order at a specific price to make the market look strong. Other traders see this depth and start buying, pushing the price up. The spoofer then cancels their large order before it gets filled and sells into the rising price. Users on TradingView reported experiencing this with crude oil futures, losing an average of 1.8 ticks per contract when apparent depth disappeared right before execution.
- Iceberg Orders: These are large orders broken into small, hidden chunks. Only a tiny fraction is visible in the DOM. As soon as the visible part is filled, another chunk appears. This creates the illusion of thin liquidity while actually absorbing massive volume quietly.
A study by the International Organization of Securities Commissions found that 41.7% of apparent market depth in equity markets disappears within 500 milliseconds. If your reaction time isn’t sub-millisecond, you are reacting to ghosts.
Tools for Analyzing Depth
To navigate these waters, you need the right tools. Basic charting software often hides the nuance of the order book. Professional traders use specialized platforms to visualize depth.
- Bookmap: A leading visual DOM tool with a 32% market share. It uses heatmaps to show where orders are resting and moving. At $299/month, it is expensive but offers superior detection of spoofing and iceberg orders.
- NinjaTrader: Popular among futures traders, offering robust DOM functionality. Reviews indicate 78% of users cite improved trade timing, though 63% note a steep learning curve requiring 40-60 hours of practice.
- Bloomberg Terminal: The institutional standard. It provides access to deep order book data across global exchanges, essential for firms managing billions in assets.
For retail traders, the cost barrier is real. Vintti’s 2024 comparison study highlighted that professional-grade DOM tools remain prohibitively expensive for many. However, free resources exist. The CME Group offers tutorial videos on reading the DOM, and communities like the r/algotrading subreddit share insights on interpreting depth patterns. One user, 'QuantTrader87', shared how DOM analysis helped identify a hidden support level for SPY, resulting in a 3.2% profit by spotting persistent buy orders accumulating over three days.
Implementing Depth Analysis in Your Strategy
Adding market depth analysis to your workflow takes time. It is not a plug-and-play indicator. You must learn to distinguish between genuine liquidity and noise. Here is a practical approach to getting started:
- Start with Simulation: Do not risk real money immediately. Use simulated trading environments for at least three months. Focus on watching how the DOM reacts to news events and large trades.
- Combine with Volume Profiles: Never use DOM in isolation. Overlay it with volume profiles to see where significant trading has occurred historically. High volume nodes often align with deep liquidity zones.
- Monitor Latency: According to MIT’s 2023 market microstructure study, a 50-millisecond delay can render DOM data obsolete in fast markets. Ensure your internet connection and platform latency are minimal.
- Watch for Imbalances: Look for sudden changes in the ratio of buy to sell orders. A rapid withdrawal of sell orders can signal an impending price spike, even if the absolute depth looks low.
Professional traders typically dedicate 15-20% of their pre-market preparation time to depth analysis, according to a 2024 Tabb Group survey. They are not just looking at prices; they are mapping the battlefield before the first shot is fired.
The Future of Liquidity Analysis
The landscape is evolving rapidly. AI-powered tools like Tradespoon’s DeepLiquidity AI, launched in August 2024, use machine learning to predict depth changes with 73.2% accuracy. These systems analyze historical patterns to forecast where liquidity will appear or disappear, giving traders a predictive edge.
Regulators are also stepping in. Following the March 2023 Treasury market volatility, where depth collapsed dramatically, the SEC proposed standardized disclosure requirements in April 2024. The Basel Committee on Banking Supervision’s proposed 2025 framework mandates depth analysis for major liquidity providers. This means transparency will likely increase, reducing some of the opacity that currently plagues retail traders.
However, the core challenge remains: depth is dynamic. It shifts with news, sentiment, and algorithmic behavior. The goal is not to find a static "perfect" depth but to understand the rhythm of the market. By mastering market depth analysis, you stop guessing where the price will go and start seeing where the money is actually sitting.
What is the difference between market depth and liquidity?
Liquidity is a broad term describing how easily an asset can be bought or sold without affecting its price. Market depth is a specific measurement of liquidity, showing the volume of buy and sell orders at various price levels in the order book. Depth provides the concrete data that defines how liquid a market truly is at any given moment.
Why is market depth important for blockchain assets?
Cryptocurrency markets are generally shallower than traditional stock or bond markets. For example, BTC-USD on Coinbase Pro had a median 2% depth of only $8.7 million in 2024, compared to billions in Treasuries. This means large trades can cause significant price slippage. Analyzing depth helps crypto traders avoid impacting the market negatively and identify genuine support/resistance levels amidst volatile order books.
What is DOM spoofing?
Spoofing is a manipulative practice where traders place large fake orders in the Depth of Market (DOM) to create the illusion of high demand or supply. They intend to cancel these orders before they are executed. This tricks other traders into moving the price in a direction favorable to the spoofer, who then profits from the artificial movement.
How do I read a Depth of Market (DOM) ladder?
A DOM ladder displays price levels in the center, with bid (buy) volumes on the left and ask (sell) volumes on the right. Each row represents a specific price point. Larger numbers indicate more orders waiting at that price. By observing how these numbers change in real-time, you can gauge immediate supply and demand pressure. Persistent large bids suggest strong support, while rapidly disappearing asks may signal upward momentum.
Is market depth analysis suitable for beginners?
It has a steep learning curve. Surveys indicate that effective use requires 40-60 hours of practice. Beginners often misinterpret temporary order imbalances as structural depth. It is recommended to start with simulated trading and focus on understanding basic order flow before attempting to trade based on complex DOM signals. Combining it with simpler indicators can help bridge the gap initially.


Christina Pearce
May 30, 2026 AT 20:30hey everyone, i just finished reading through this whole guide on market depth and it actually made a lot of sense to me. the grocery store analogy was super helpful for visualizing why liquidity matters so much when you are trying to execute large orders without moving the price around too much. i have always been confused about the difference between volume and actual depth, but seeing how resting orders create that cushion really clicked for me. thanks for breaking down the technical jargon into something we can all understand.
Barclay Chantel
May 31, 2026 AT 17:58typical retail fluff piece designed to make you feel like you understand high frequency trading while you are still using a lagging charting platform. the reality is that if you do not have sub-millisecond latency and direct exchange access, you are already dead in the water against the algos. discussing spoofing as if it is some secret trick is laughable because every institutional desk has filters for that noise built into their execution algorithms. stop pretending the dom ladder is your friend when it is clearly a trap set by market makers who know exactly where your stops are sitting.
Miss Masquer
June 1, 2026 AT 15:37i have to say that the section regarding the danger of illusion really resonated with my own experiences in the futures markets over the last few years, especially when i was trading crude oil contracts during periods of heightened geopolitical tension. it is quite fascinating to consider how the mere appearance of liquidity can be manipulated by sophisticated algorithms that place and cancel orders in milliseconds, effectively creating a phantom support level that vanishes the moment a significant volume of genuine buying interest arrives at that specific price point. this phenomenon underscores the critical importance of not relying solely on static snapshots of the order book but rather observing the dynamic flow of orders in real time to discern whether the displayed depth represents true commitment from buyers or merely speculative positioning intended to lure other participants into false confidence.
Joshua Alcover
June 2, 2026 AT 08:17the fundamental issue here is that domestic capital flows are being distorted by foreign entities manipulating our financial infrastructure through these opaque crypto exchanges which operate outside the regulatory purview of the securities and exchange commission thereby undermining the sovereignty of our national monetary policy and exposing american investors to predatory practices that would never be tolerated in the traditional equity markets governed by strict federal oversight mechanisms designed to protect the integrity of our economic system.
Diana Morris
June 3, 2026 AT 12:17stop whining about hft and get better tools or quit. nobody cares about your feelings when the market eats you alive. learn to read the tape or go back to day trading penny stocks on your phone.
Dianne Wright
June 4, 2026 AT 21:08you people really think you can beat the bots with a free dom viewer? its pathetic honestly. i watch you guys chase green candles and get rekt every single day. the market does not care about your strategy or your feelings. it only cares about liquidity extraction and you are nothing but food for the machine. keep telling yourself that bookmap will save you while you slowly bleed out your account balance month after month.
Debbie Lewis
June 5, 2026 AT 12:23i found the part about iceberg orders interesting since i have seen those patterns before but never knew what they were called. it makes sense that big players hide their size to avoid slippage. i guess most of us are just looking at the tip of the iceberg literally.
Joe Clements
June 5, 2026 AT 16:25this is a really helpful breakdown thanks for sharing. i appreciate how you explained the difference between shallow and deep markets with concrete numbers. it helps put things into perspective especially when trading smaller cap stocks versus large caps.
Rosie Morris
June 7, 2026 AT 14:16im new to all this dom stuff and its kinda overwhelming tbh. the charts look cool but i dont know if im actually seeing anything useful or just random noise. does anyone have tips for beginners on where to start besides sim trading?
lorna erni
June 7, 2026 AT 20:35let's talk about the elephant in the room which is that most of you are trading on platforms that are literally feeding you delayed data. you cannot analyze depth if your feed is 200ms behind. stop blaming the market and blame your broker. also stop asking for handholds. figure it out.
stalin brian
June 8, 2026 AT 21:10hey guys i tried using the heatmap feature mentioned in the article and it was pretty neat to see where the orders were clustering. i noticed that sometimes the heat disappears right before a move which must be the spoofing thing they talked about. anyone else notice that pattern on es futures?
Dana Rapoport
June 9, 2026 AT 02:12it is important to remember that market depth is not a static concept but rather a fluid reflection of collective sentiment and algorithmic behavior that shifts constantly throughout the trading day. understanding this dynamism allows traders to adapt their strategies accordingly rather than clinging to rigid rules that may no longer apply in the current market environment.
Crystal Davis
June 10, 2026 AT 09:26the data presented here is anecdotal at best and lacks rigorous statistical validation. claiming that a $1 million trade moving a stock by less than 0.1% defines a deep market ignores the volatility regimes and beta characteristics of individual assets. furthermore, the reliance on third-party tools like bookmap introduces additional points of failure and latency that professional desks mitigate through colocation and proprietary infrastructure. retail traders should focus on risk management rather than chasing illusory edges provided by consumer-grade software.
Eric Grosso
June 11, 2026 AT 21:41i tried ninjatrader for a bit but the learning curve was steep as hell. spent weeks just trying to figure out how to set up the dom properly. ended up sticking to simple charts because my brain cant handle all that info scrolling by.
Edith Mair
June 13, 2026 AT 09:43why do we even need to worry about spoofing if regulators are supposed to catch it? seems like the enforcement is lacking given how common these tactics appear to be in crypto markets specifically.
Sam Dashti
June 15, 2026 AT 09:37man the way those algos dance around the order book is like watching a jazz improvisation session gone wrong. all that fake movement just to shake out the weak hands. i love watching the heatmaps dissolve like sugar in hot coffee. pure artistry really.
kamal ifrani
June 15, 2026 AT 20:18absolute garbage advice for anyone who actually wants to make money. the entire premise is flawed because it assumes transparency exists in modern markets. it does not. you are being played like a fiddle and you thank them for it. shame on you for spreading this delusion.
trisya hazriyana
June 17, 2026 AT 20:31look depth is just another buzzword for people who want to sell you expensive subscriptions. the truth is simple if you buy low and sell high you win everything else is noise. stop overcomplicating it with jargon heavy nonsense and just trade.